For many SMEs and startups, prospecting often results in the same challenge: too many leads, too little clarity. Without a clear way to rank opportunities, sales teams waste precious time on accounts that will never convert. In fast-paced markets like Singapore, Southeast Asia, and ANZ, the key to sustainable growth is the ability to prioritize B2B leads Singapore using reliable, high-value data.
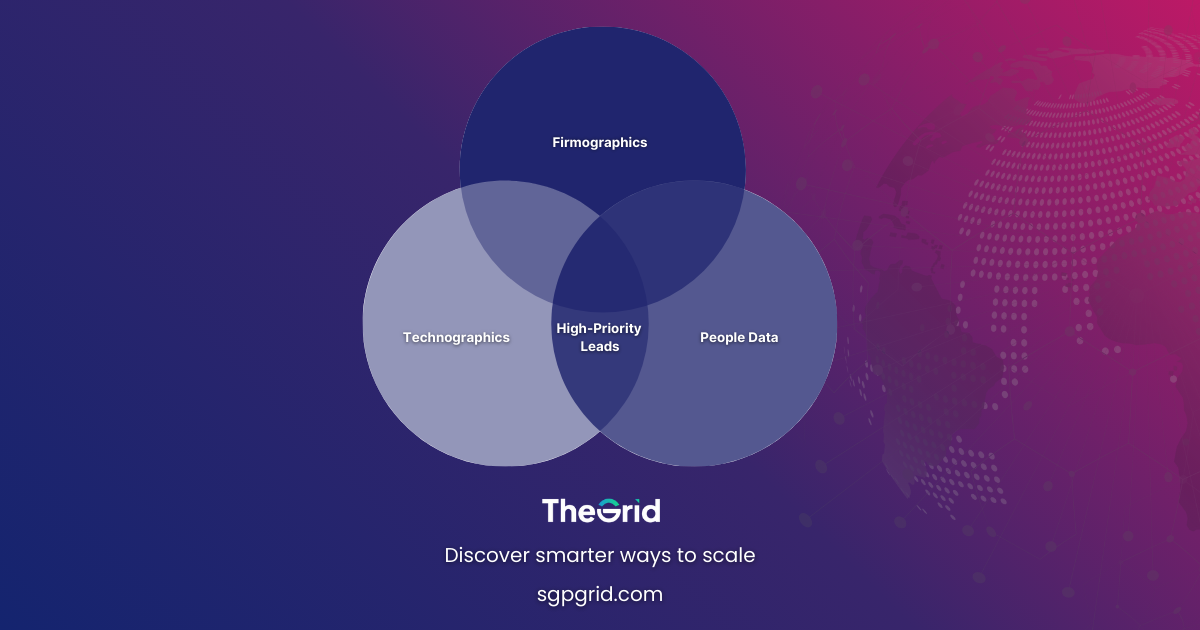
By combining firmographics, technographics, and people data, businesses can practice true data-driven prospecting, identifying the companies with the strongest buying potential. This layered approach helps SMEs sharpen their sales strategy SEA, improve sales pipeline accuracy, and build more predictable revenue growth.
What are Firmographics, Technographics, and People Data?
Firmographics
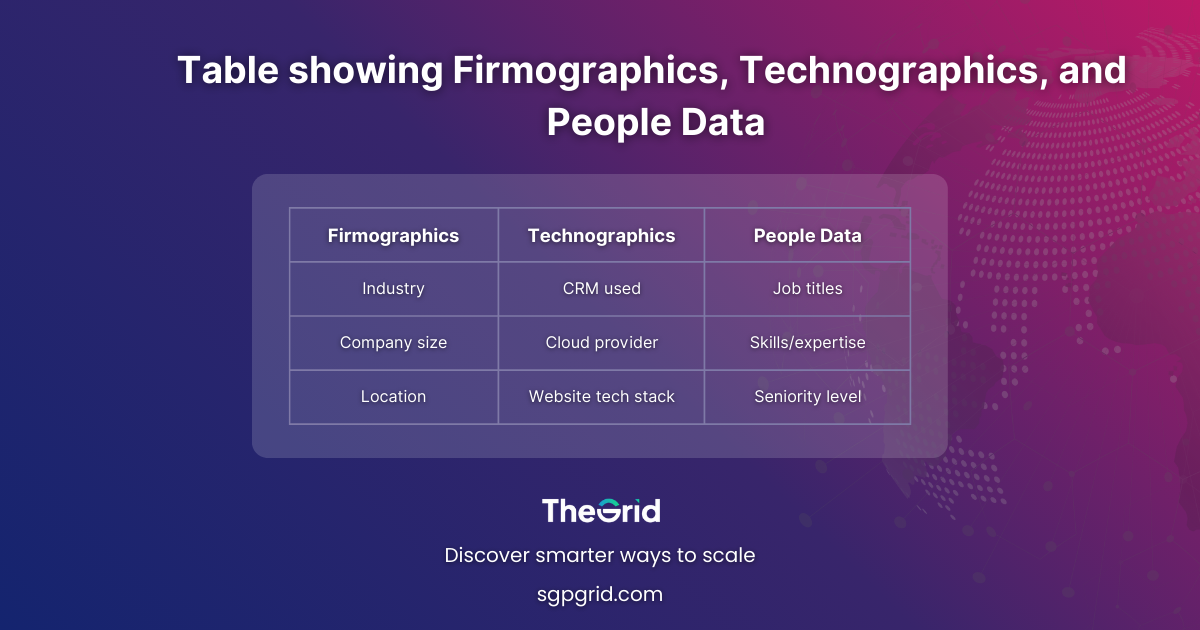
Firmographics describe the structural characteristics of a company, including industry, size, revenue band, growth stage, and location.
Example: A fintech startup may discover that its strongest conversions come from financial institutions with more than 200 employees. This insight guides smarter targeting.
Technographics
Technographics reveal the technologies a company already uses. This includes CRM systems, HR platforms, cloud software, or legacy tools.
Example: A SaaS company can better position its solution by knowing whether a prospect uses Salesforce, Oracle, or a custom-built system.
People Data
People data focuses on the internal organization who the decision-makers are, their roles, seniority, responsibilities, and influence. Leveraging decision-maker data SEA ensures outreach reaches the right person faster and more effectively.
When combined, firmographics, technographics, and people data provide a multi-dimensional understanding of prospect readiness.
Why These Data Types Matter Together
Firmographics alone might tell you a prospect fits your ICP. Technographics might show whether your solution integrates well. People data tells you who will influence or approve the purchase. But together, these three categories enable stronger lead scoring methods and sharper prioritization.
By layering these data points, SMEs gain:
- a complete picture of prospect fit
- better insight into buying readiness
- a clearer understanding of internal decision pathways
This leads to more accurate targeting, a healthier pipeline, and measurable improvements in startup sales targeting.
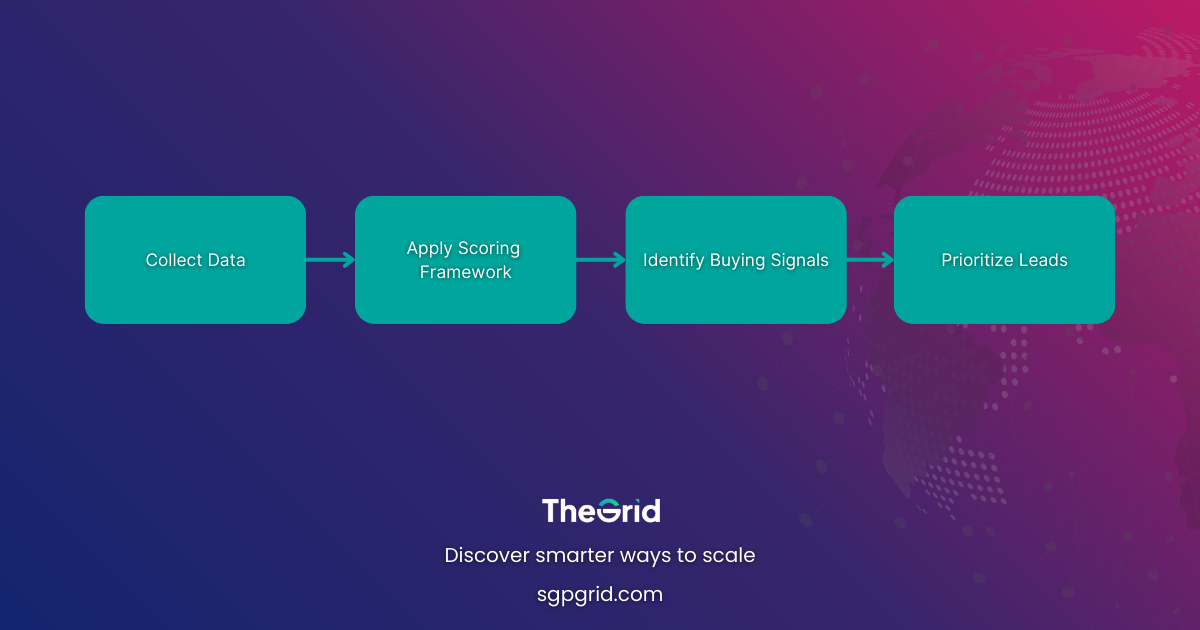
How to Use Data to Prioritize Leads
Step 1: Build a Scoring Framework
Assign weights to each data category. For instance:
- 40% firmographics
- 30% technographics
- 30% people data
Using weighted scoring helps identify the prospects most likely to convert and ensures a more strategic use of time.
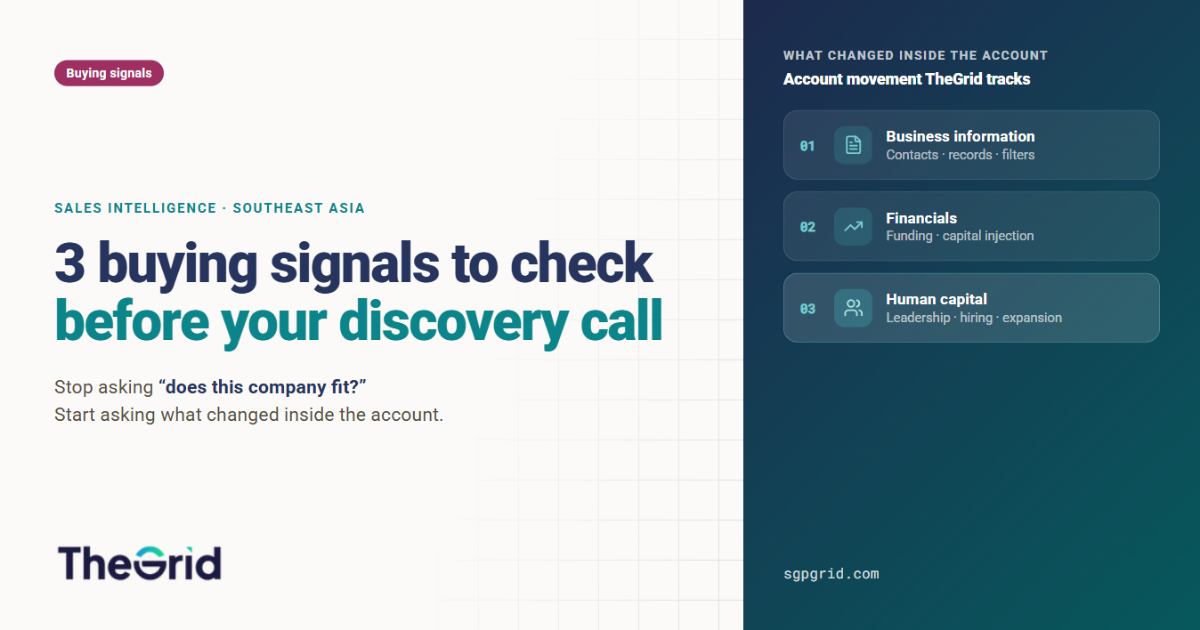
Step 2: Identify Buying Signals
Buying signals, such as recent funding rounds, executive hires, technology upgrades, or regional expansion—are powerful indicators of purchase intent. Adding these signals into your lead scoring model increases accuracy and strengthens sales pipeline accuracy.
Step 3: Validate with Real Data
The Grid provides verified business data Singapore, real technographics, and precise decision-maker data SEA. With The Grid sales intelligence, SMEs gain access to structured datasets across SEA, replacing guesswork with verified insights.
Validated data ensures that teams stop relying on outdated spreadsheets and start prioritizing prospects using real-world information.
Real-World Example
A Singapore-based HR SaaS startup initially targeted all SMEs with over 50 employees. But conversions remained low. When the team incorporated firmographics, technographics, and people data into their process, they discovered that companies already using cloud-based HR systems and with HR directors actively hiring were significantly more likely to convert.
By focusing on these high-score accounts, the startup doubled conversion rates in six months and built a healthier, more predictable pipeline. This demonstrates how startup sales targeting becomes dramatically more effective when driven by the right data.
Conclusion
Not all leads deserve equal attention. For SMEs and startups competing in Singapore and Southeast Asia, the ability to prioritize B2B leads Singapore can make the difference between a slow pipeline and sustainable growth.
By combining firmographics, technographics, and people data, businesses gain a deeper understanding of prospect fit, improve efficiency, and strengthen their overall SME sales strategy SEA. Platforms like The Grid, powered by accurate firmographics, real technographics, and verified decision-maker data SEA—enable SMEs to identify high-value prospects earlier and execute smarter, more strategic outreach.
Smart prioritization isn’t about having more leads. It’s about having the right ones.
Disclaimer
This article is for informational purposes only. Data and examples are based on publicly available information and insights from The Grid platform. Results may vary depending on the business context.
References
- HubSpot: https://blog.hubspot.com/sales/firmographics
- Gartner Technographic Insights: https://www.gartner.com/en/insights/technographics
- LinkedIn B2B Decision-Makers Report: https://business.linkedin.com/marketing-solutions/b2b-institute